Commercial building solar panels in Henley-on-Thames
For a landlord in Henley-on-Thames, a roof array is increasingly a question about the EPC rating as much as the electricity bill. Each survey records the usable area once edge strips, plant and walkways are taken out, the load the deck can take, and whether the lease lets the occupier alter the roof.
899 kWh per kWp a year at this latitude, so a 210 kWp array models at about 189,000 kWh. Source: EU PVGIS v5.2, SARAH3, 10 degree pitch, 14 percent system loss.
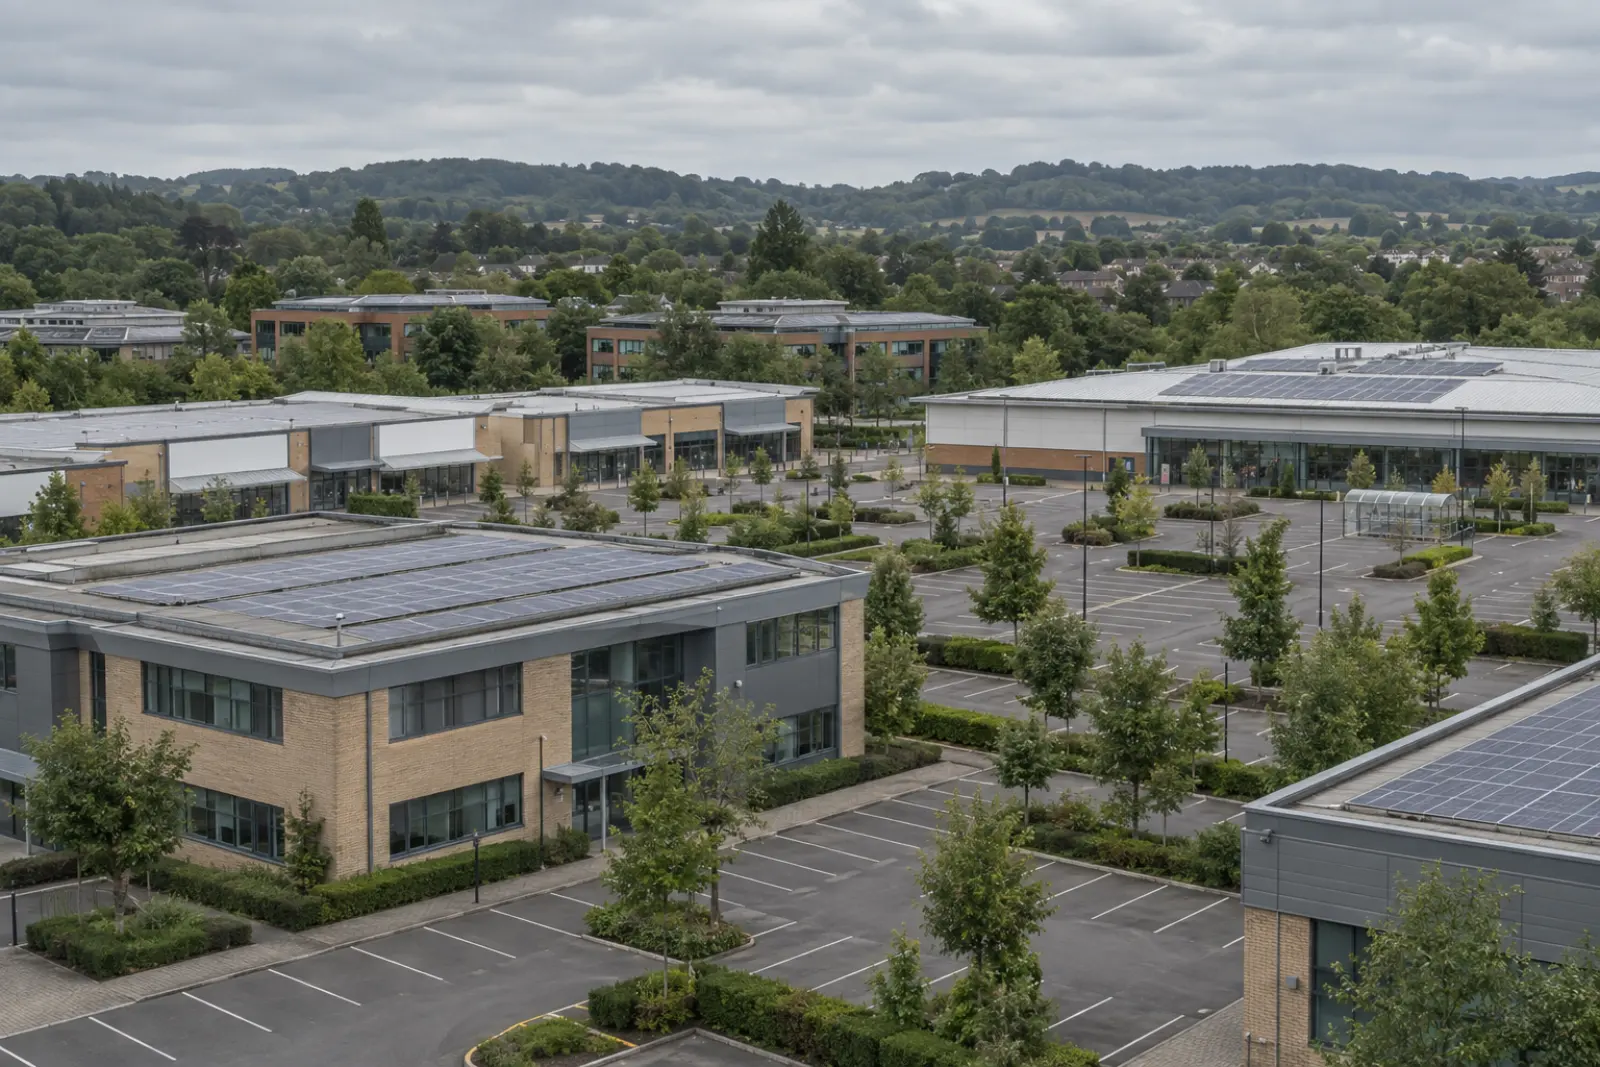
Book a roof survey in Henley-on-ThamesIllustrative layout for a flat commercial roof of this size, with plant, shade and access kept clear. Your own figures come from the roof survey.
- 11,780
- people in the Henley-on-Thames built-up area (ONS Census 2021)
- 1,110
- office properties on the rating list in South Oxfordshire (VOA, March 2025)
- 870
- retail properties, 10 of them large-format (VOA, March 2025)
- 0
- named commercial rooftop schemes on the planning record nearby (REPD, Q1 2026)
Solar for offices and retail across Oxfordshire
How much sun a Henley-on-Thames roof gets
Modelled irradiation here is 1,153 kWh per square metre a year on a low-tilt array, which works out at 899 kWh for every kWp installed (EU PVGIS v5.2, SARAH3, 10 degree pitch, 14 percent system loss). That is within a few percent of the mean across the towns we cover, so the weather is not what decides the case here. Opening hours are.
The rating list for South Oxfordshire
The Valuation Office Agency's rating list puts 1,110 office and 870 retail properties in South Oxfordshire, covering about 172,000 and 144,000 square metres of floorspace respectively. By office stock the district sits above the median of the 318 districts in England and Wales; by retail stock it sits below the median of the 318 districts in England and Wales.
10 of those retail properties are superstores, large food stores, large shops or retail warehouses, together about 32,000 square metres. Single storey boxes of that size are where most commercial rooftop solar actually gets built, because the roof is big, flat or shallow, and uninterrupted.
The same list carries 310 hotel, leisure and assembly properties in the district. Leisure centres and hotels run seven days a week, which puts weekend generation to use that an office would export.
Source: Valuation Office Agency, Non-domestic rating: business floorspace, 31 March 2025 (published December 2025), counts and floorspace by special category code and local authority district, England and Wales.
The built-up area holds about 11,780 people, so the stock here runs to high street premises, a supermarket or two and the odd hotel (ONS Census 2021 built-up areas).
Surveys run across RG postcodes, RG9 outward.
Henley-on-Thames ranks 4 of 8 towns we cover in Oxfordshire on modelled yield, against a national mean of 886 kWh per kWp. The county runs from 891 to 913, a spread of 22 kWh per kWp. Within Oxfordshire that difference is small enough to ignore: where the building sits is not what decides this scheme, your consumption pattern is.
All solar on record near RG9
Every scheme in this postcode district in the government's Renewable Energy Planning Database, Q1 2026, ground and roof mounted, commercial or not. None of them is ours. Together they are a fair guide to how the local network has been treating export applications.
| Scheme | Operator | Capacity | Mounting | Status |
|---|---|---|---|---|
| Crockmore Lane, Fawley - Solar Panels | Private Developer | 0.2 MW | Ground | Application Refused |
Grid connection through Scottish and Southern Electricity Networks
Connections around Henley-on-Thames are handled by Scottish and Southern Electricity Networks, which sets the export limit for the site. Above 3.68 kW per phase the connection runs under G99, so the export limit is agreed in advance rather than assumed. Where the local network is constrained, an export-limited connection usually still makes the scheme work, because a commercial building uses most of what the roof makes during the working day.
Across Oxfordshire the planning database records 149 solar schemes totalling 2544 MW, of which 31 are operational (REPD Q1 2026).
Send us the postcode
Tell us where the building is, roughly how big the roof is, and whether you own it or lease it. We come back with what it can carry, what it would generate against your consumption, and the three ways to pay for it.
Lenzie Consulting Ltd arranges the survey and passes your details to our MCS-certified installation partner so they can quote.
Questions about solar in Henley-on-Thames
- How much would solar on a commercial building in Henley-on-Thames generate?
- The model gives 899 kWh for every kWp installed here, so 210 kWp is about 189,000 kWh a year before shading losses. Allow roughly 1,390 m² of roof for it. Source: EU PVGIS v5.2, SARAH3, 10 degree pitch, 14 percent system loss.
- Is planning permission needed for panels on a Henley-on-Thames office or shop?
- Usually not a full application. In England, panels on the roof of a non-domestic building are permitted development under Class J of Part 14 of the General Permitted Development Order, with no capacity cap since December 2023. Above 50 kW, which covers most commercial arrays, you must first apply to South Oxfordshire for a determination on prior approval of the design and appearance, in particular glare on neighbouring land. On a flat roof panels may stand no more than 1 metre above the roof and must sit at least 1 metre from its edge, and listed buildings and scheduled monuments are excluded. See our planning permission guide for the detail.
- Will rooftop solar improve the EPC rating of a let building in Henley-on-Thames?
- It can. A non-domestic EPC is an asset rating, and on-site generation counts in the calculation, so an array usually lifts the score. Let property in England and Wales must be EPC E or better today. The government's interim response of 18 June 2026 proposes EPC B, where cost effective, from 2031 for let buildings over 1,000 m², and drops the EPC C step once planned for 2027. How far solar moves a particular building depends on its fabric and services, which is why the EPC assessor models it before anything is fitted.
- Does the grid around Henley-on-Thames have capacity for export?
- Scottish and Southern Electricity Networks is the distribution network operator for Oxfordshire. Arrays above 3.68 kW per phase connect under G99, and the application sets the export limit. It is part of the design work we arrange.